I just finished updating our NHL Stats website to 3.3. What does that mean I hear you ask? Awesomeness a plenty, that’s what.. and to shed some light on the matter here’s a couple of new features (long awaited mind you) that has managed to finally become a part of our intricate obsessive statistical analysis.
Features added
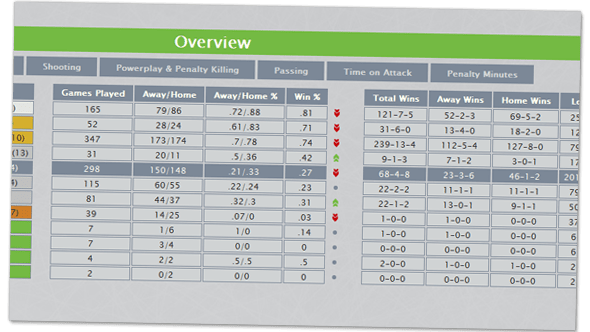
All Stats added, including (not available anywhere else) statistics like e.g. Away/Home Win Ratios and Shots Against/Game. All of them displayed nicely in sortable tables, made possible by Stuart Langridge’s sorttable.js.
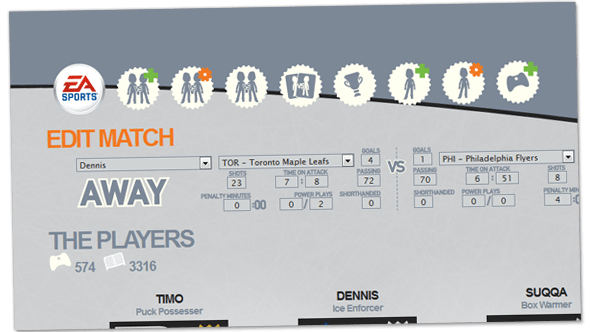
Edit Match added.
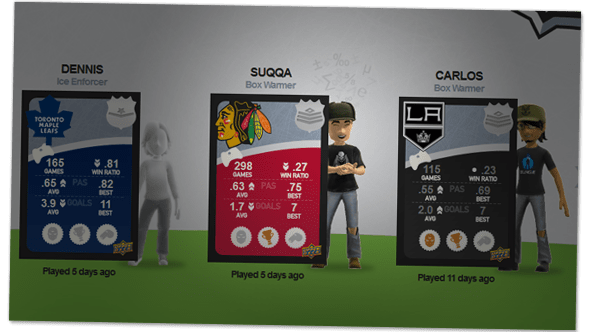
In the Zone indicator added. The player’s avatar becomes entangled with mathematical symbols one hour every day to signal that this is the hour when the player has won most of their games. Edit: Thanks to beije for guiding me in the right direction when I was trying to extrapolate the new data (number of wins correlating to time stamp) from our db, GROUP BY is the shit in this case!
And finally, rank symbol Unranked added.